Out-of-Home Advertising (OOH) data is able to measure audiences like never before. From automation and integrations to advanced monitoring and forecasting, to self-service platforms, there are many positive trends in outdoor advertising that will help advertisers make more effective campaigns and prove ROI. But there are some challenges that come along with an ever-increasing focus on individual privacy, and a need to be able to validate that the measurement data is indeed accurate.
In this article, we will explain the top data trends we are seeing in the OOH space, new data capabilities, and how Billups is staying ahead of increasingly stringent data privacy regulations to make outdoor advertising measurable.
1. Privacy Changes
IOS 14, released in 2021, improved the transparency of location tracking. Developers must get express user consent before tracking their apps. However, users can decline all tracking by toggling off the "Allow Apps to Request to Track" option in the Privacy section of the Settings app. Also in 2021, IOS 15 was released to further improve location tracking privacy protection. It added a new section in settings that allows users to see how often apps have accessed their locations during the last seven days. It also shows which apps have contacted other domains and how recently they have contacted them.
Though Apple’s IOS 16 release in 2022 did not further restrict location tracking, privacy protection has been a strong theme for the past 2 years. Consequently, users have a growing awareness of location tracking and a fair number of mobile phone users choose to avoid tracking as much as possible.
This imposes a great challenge for the industry of device mobility in general. Companies that partner with mobile apps to gather, aggregate and sell mobile data are struggling due to the iOS updates. Google’s Android 13 released in 2022 did not add more location tracking protection. Android users are able to disable location tracking of Apps, but users who want to opt-out of location tracking must manually manage their permissions through settings. So as of now, mobility panels in the industry contain many more Android devices than Apple devices, while in reality, the market share of Apple vs Android is about equal. This is one of the reasons why normalizations of measurements are so important, even though selection bias exists in the mobility panel.
Billups is actively researching new solutions to get ahead of the inevitable future where device IDs no longer exist. Last year, Billups proposed the use of device cohorts determined by consumer behaviors, travel patterns, app installments, etc. These cohorts aggregate devices based on similar consumer behaviors, making individual devices within each cohort nearly impossible to identify. This protects consumer privacy while still allowing us to collect the data necessary to provide targeting, measurement, and attribution for our outdoor ads.
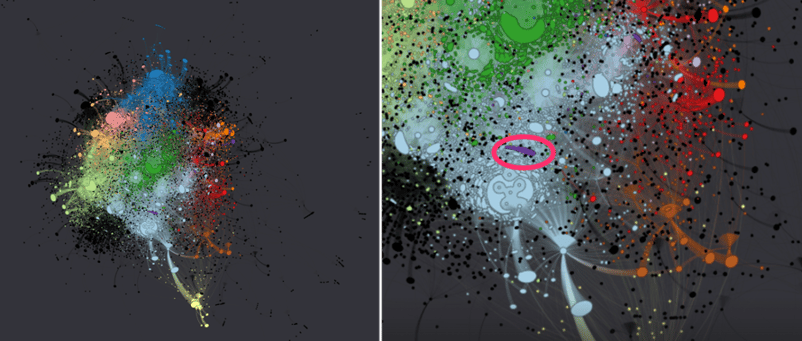
This visualization was created by our team for an athletic apparel company. It shows each color as a representation of a group of people who share similar behaviors. The red circle around the purple color indicates people who are runners, visited the brand’s store and stopped at Jamba Juice in Portland.
Meanwhile, we have been developing normalization algorithms to derive stable and accurate measurements at the population level. Such measures are critical due to the fluctuations in the volume and quality of the device location data or mobility panel. We have had early success in this process by using publicly available data from state and federal sources to calibrate our algorithms. In 2023, we will further improve such algorithms while we continue to research prototypes of targeting without device IDs.
2. Metrics for Success and Validation of Measurement
In the beginning of 2022, Billups envisioned that the OOH industry would be eager to see additional metrics to provide insights into the effectiveness of exposures. Those additional metrics include computer vision, the SSI model, advanced visibility, etc. This will continue to be what we anticipate for 2023 as well.
While in 2022 the OOH industry continued to recover, the demand for various measurements including foot traffic, number of exposures or exposed audiences and more advanced analytics was also on the rise. Automations around serving measurements are more important than ever and platforms that enable self-serve or automatic measurements will continue to attract much traffic in 2023.
While serving OOH measurements more quickly and easily is definitely desirable to clients, the providers currently on the market vary in the rigor of measurements. There is a general lack of transparency in measurement methodologies and assumptions made. Some measurement providers aim for a larger lift by manipulating methodologies, which misleads business decisions and can hide potential campaign planning issues. A proper measurement should emphasize the importance of A/B testing and correct setups of control and treated groups to provide realistic measures of campaign effectiveness. Markets will soon realize some of the measurement providers are not reliable and seek greater validation of measurement results.
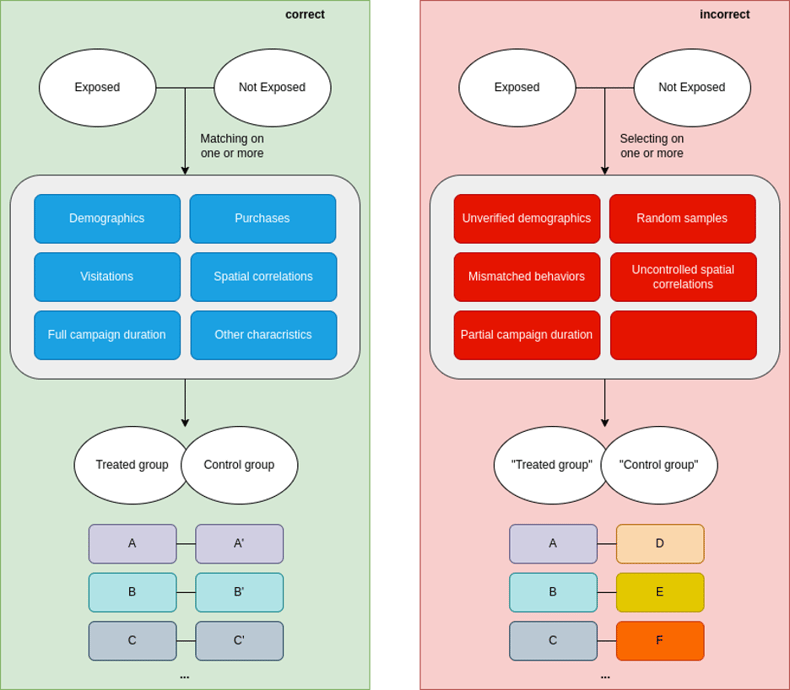
Visual chart of correct and incorrect setups of control vs treated groups. The incorrect (in red) shows a method of cherry-picking that produces unrealistic and artificial statistics.
Validating measurements will be a major trend in the coming years. And measurement providers who can both detail the methodologies and provide validations of measurements will be able to earn more trust and thus a larger share of the market.
3. Capabilities for Forecasting and Monitoring OOH
Last year, we talked about a probabilistic approach to consumer journeys and how that can be applied to measure the number of cars passing by an OOH unit.
Alongside this probabilistic model, we also developed a machine-learning model to predict exposures to OOH units. This model also utilizes the mobility panel and is trained on statistics of device activities nearby and leading to the OOH units. When we check our numbers with published data and other reliable sources of truth, the predictions made by the machine learning model are close to reality. This gives us another way to derive measurements of OOH campaigns without the necessity of computing consumer journeys.
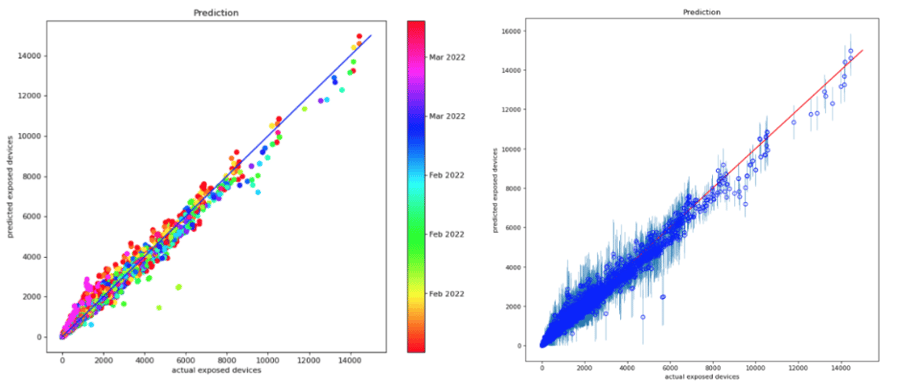
The above figures display the comparison of the model predicted and the actual measured daily exposed devices for various units in the Portland Metro. The left panel has the dates of exposed devices color-coded while the right panel displays the information of residual errors.
From the trained machine learning model, we are able to conclude which characteristics of devices’ activities are critical for seeing an OOH unit, and with those characteristics we can select the devices that could potentially see the unit. This leads to another success in 2022, which is the implementation of a more efficient route to measure exposures. This more efficient method completes consumer journeys for a small pool of devices that are selected based on their activities near OOH units. It significantly reduces the computation time and storage, while keeping the same high quality of measurement.
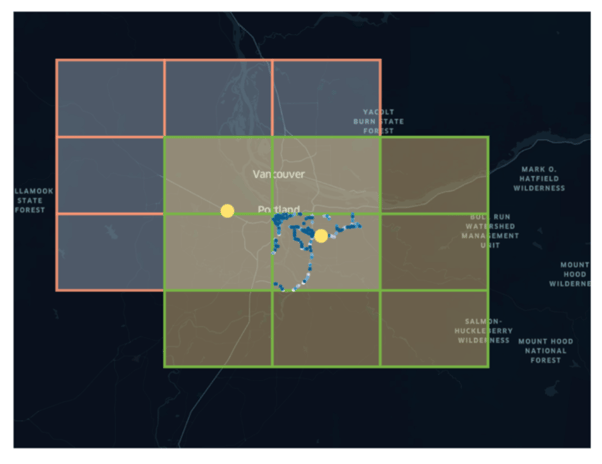
Example of using a pool of devices (shown in the blue colors within the green square) that pass by or lead to the units (shown in yellow). The rest of the devices in the market outside of the green square can be ignored.
Most importantly, the improved efficiency enables the capability of providing Opportunity to See (OTS) measurements on a daily basis and allows clients to witness the unfolding of an ongoing campaign.
4. Smart Campaign Planning
Traditionally OOH campaign planning was a manual and time-consuming process. To enable more efficiency, one of the most important tools to empower media planning and business decision-making is the timely, complete, and accurate information of OOH inventories. Inventory information includes the current availability of inventories, previous and forecasted prices, vendor details and more.
The integration of OOH planning with technologies continues to be an ongoing trend. Many of those integrations would not be possible without the help of data science and machine learning.
For example, a campaign planning platform or tool with the most up-to-date inventory information can dramatically reduce manual efforts to obtain current information. Machine learning models that predict future price trends from historical prices can offer a baseline of expectations and assist business negotiations. Optimization models include budget constraints and campaign target goals such as market reach, the market reach of a certain demographic group, reach to competitors of the consumer brands, etc.
5. New Applications will Improve Precision of Measurements
While the emphasis of our tech team is placed on OOH campaigns, there is no limit to how we can apply our data science and engineering products. As we said in our 2022 trends article, we believe this will be an ongoing trend for many years to come. Precision and accuracy will still be the most important goal in measuring OOH effectiveness. But technologies developed to improve the precision and accuracy of measurements will also enable fresh ways of interacting with the media, audiences, and metrics for success involved in OOH.
Follow the Latest OOH Data Trends with Billups!
Billups uses data science to accurately depict how many eyes were on your OOH advertisement. Take advantage of our services and attribution products to effectively measure the success of your outdoor advertising campaigns.
Contact us to get started on your next campaign today!